Understanding Land Use Patterns
Agricultural Decision Making
One of economic geography's primary goals is to explain or make sense of the land-use patterns we see on Earth's surface. Not surprisingly, economic geographers use economic reasons to explain the location of economic activities. If geographers can find reasons why some activities are found in some places but not others, this implies that some regions are more advantageous than others for particular activities. In other words, all regions are not equal, and the spatial arrangement of economic activities is not random; it is the result of decisions made by individuals, small businesses, multinational corporations, and governments.
One of the first land-use patterns that geographers studied is the pattern of crops across an agricultural landscape. Different crops represent different agricultural land uses. Why are some crops grown in some locations but not others? How do farmers decide which crops to plant? Some of these decisions are based on environmental factors. For example, citrus fruits are grown in frost-free regions because a hard freeze would destroy the crop and maybe even the fruit trees. In most regions, however, farmers can grow a variety of crops, and in those circumstances, how do they decide whether to grow greenhouse tomatoes or wheat?
One of the assumptions frequently made by economists is that decision-makers choose to do what is best for them economically. In other words, if they have a choice between several alternative actions, they will choose to pursue the one that generates the greatest payoff or economic return. This is how economic geographers explain which crop farmers choose to grow in a particular place. Farmers' net returns are the difference between the amount they receive when they sell their crops and the costs they incur to grow, harvest, and get their crops to market. Economic geographers call this difference, or net return, location (or land) rent. In general, then, economic geographers expect farmers to use their land as productively as possible in order to produce the highest rent.
One of the most important costs farmers face is the cost of getting their crop to market. For example, one farmer, who is also a geographer, recently reported that half the cost of shipping his soybeans to Hong Kong was a result of getting the crop to a Mississippi River barge terminal located only 40 miles away. He says, "If the barge terminal were 80 or 90 miles away, it would no longer be feasible for me to grow grain for the international market" (Gersmehl 2004, 32). It was this overwhelming importance of transportation costs that prompted Johann von Thünen to wonder if he could explain the crop choices farmers made, and thus agricultural land-use patterns, by evaluating the impact of crops' transportation costs on the location rent of agricultural land.
It was apparent to von Thünen that, as the distance from the market increased, transportation costs would increase, and locations would become less desirable because they would generate lower rents for farmers. Farmers located far from the market would receive a lower return because their costs, specifically their transportation costs, would be higher than the costs of farmers who were located nearer to the market.
Of course, different crops have different transportation rates. Some crops are expensive to ship because they require special handling to keep them from spoiling or being damaged or because they are difficult to ship. Therefore the transportation costs for some crops will increase very rapidly as distance from the market increases. For other crops, transportation rates are lower, and costs grow more slowly as distance from the market increases. Remember, as costs increase, the return to farmers decreases, so returns for crops that are expensive to ship will rapidly decline to zero at short distances from the market, whereas for crops easier to ship, rents will decline much more slowly. Therefore, it makes sense that crops with high transportation rates and rapidly declining rents must be grown nearer the market than crops with lower transportation rates. Think about the two crops mentioned earlier, greenhouse tomatoes and wheat. Transporting tomatoes for your dinner salad is more expensive than shipping wheat because tomatoes must be handled carefully and kept cool if they are to arrive at your local supermarket in good condition. Wheat, on the other hand, does not spoil easily and can be hauled in bulk by truck or rail. So where do you think greenhouses will be located, and where do you think wheat will be grown? Which will be produced closer to the market?
 |
 |
|
Map 1 |
Map 2 |
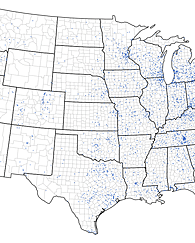
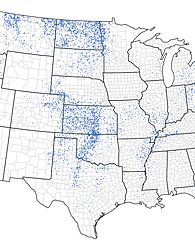
Look at the two maps. Map 1 shows the locations of farms with greenhouses, and Map 2 shows where wheat is grown. Do the maps support your hypothesis? Are greenhouse crops grown closer to markets than wheat? Locate Dallas, Houston, Oklahoma City, Tulsa, Nashville, St. Louis, Kansas City, Indianapolis, Denver, Lincoln, Chicago, Milwaukee, and Minneapolis on the maps. Notice the clusters of dots around these places on Map 1 but not Map 2. Because the cost of transporting wheat is lower, wheat farmers can grow their crops farther from the market than farmers producing greenhouse tomatoes.
Costs in Urban Areas
Once you understand that accessibility (lower transportation costs) makes locations advantageous, you can use this concept to explain other patterns of land use. Most Americans live in cities. Urban land-use patterns are also related to accessibility and land rents. In agricultural regions, the crop that produces the highest return at a location is the crop that farmers will choose to grow there. In urban areas, the reasoning is the same—the land use that generates the highest rent in a particular place is the one that will be found there.
Imagine that a corner lot becomes available near the center of a large city. Two individuals are interested in the site. One is thinking of putting a used-car lot on the site, whereas the other wants to locate a branch office of a large bank on the lot. Which will generate the highest rent, or economic return, on this downtown lot? Because the bank will earn a higher return, its owners will be willing to offer more for the lot than the owners of the used-car lot. In a very real sense, the lot is worth more to the bankers because they can use it more productively (to create more rent), and therefore they can and will be willing to offer the seller more for the site than their car-lot competitor.
Some land uses generate modest returns per acre or square foot of space, while others generate large rents. A department store generates more dollars per square foot of space than a discount store. This enables the department store to pay for a highly advantageous, highly accessible central city location while forcing less-productive land uses to locate on less-advantageous, less-accessible sites. Think about the large cities you have visited. Do land uses such as nurseries, kennels, warehouses, car lots, and discount stores generate the most dollars per square foot of space they occupy? Where are they located? What types of land uses produce high returns per square foot? Where are land uses such as banks, specialty shops, luxury hotels, fancy restaurants, and office headquarters located?
If you understand this simple concept, first noticed by von Thünen, it can help you understand the spatial pattern of economic activities that you see in the real world. Just remember that some land uses generate more rent than others, and when land uses compete for a location, the land use that creates the highest return can offer the most for the location. Because a seller sells land to the highest bidder, the land use that produces the highest rent is the one that gets to occupy the site.
References
Gersmehl, Phillip. 2004. "The Geography of Agriculture and Food Production." In A Teacher's Guide to Advanced Placement Geography: Essays, Strategies, and Resources, ed. R. S. Bednarz, 31-36. Jacksonville, Alabama: National Council for Geographic Education.
United States Department of Agriculture. 2002 Census of Agriculture.
Authored by
Robert Bednarz
Texas A&M University
College Station, Texas